I like some games that use buckets of dice, but I actually hate the dice part. They get everywhere. I've heard of dice towers, box lids, dice trays….it's like herding cats. You end up with dice all over the table. Ruins the illusion for me.
So I just finished a project I started a while ago. It is an Excel file that converts your standard "hit on a 5+" type mechanic with roll 2D6 like decimal dice, generating results from 11 to 66.
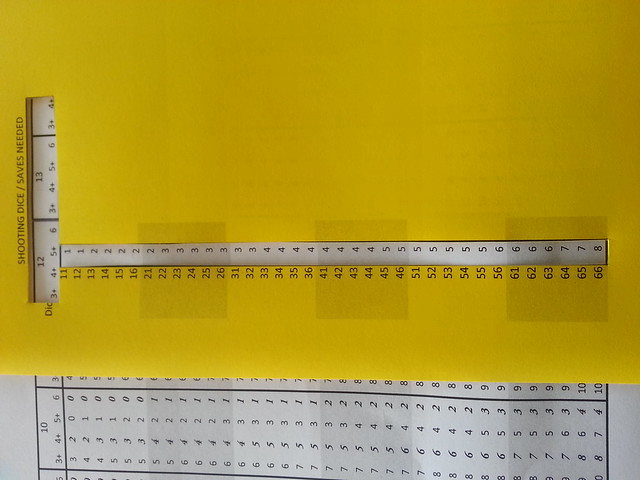
The chart is pretty big but I'm making a "slider" to make it easy to read.
Here's how it works: the columns are "dice thrown" from 5 to 25 (for 5 dice or less, roll dice). This is Rate of Fire in Flames of War. It might be weapon strength in some other rules, or the number of figures in the unit.
For each column there are 4 sub-columns, one for Hit on 3+, Hit on 4+, Hit on 5+ and Hit on 6.
The rows are the 2D6 – from 11 to 66 – results. Cross reference to get the number of hits.
Example:
My HMG platoon is firing 18 dice at your troops, and hit on a 5+. I roll a red D6 (tens) and a white D6 (ones) scoring a 4 and a 2 respectively. I cross reference 42 with the 18/5+ column and it yields a 6. I have scored 6 hits.
Your platoon saves on a 5+. You need to make 6 saves so you repeat the process using the 6/5+ column. Rolling the 2D6 you score a 35. Cross referencing yields a 2. You made 2 saves and took 4 hits.
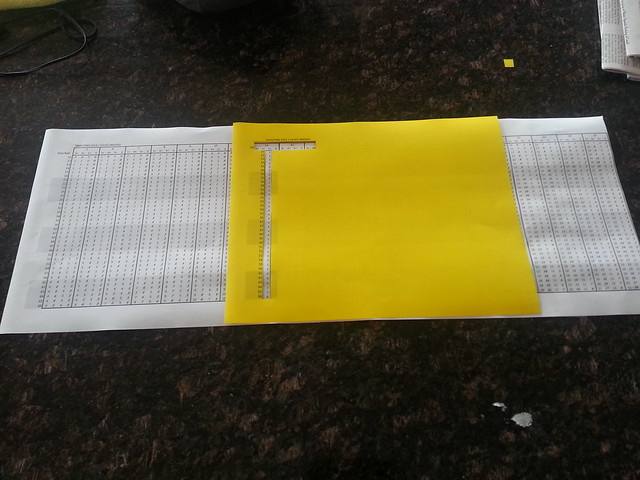
The chart is designed for the GM to use, not the players. My plan is to glue it to posterboard, and make a sliding piece that allows you to select the appropriate column. The slider will have the 11-66 along one side. I think it will be faster than even counting up 18 dice let alone rolling them, sorting out the 5+ and then repeating for saves.
Than again, I prefer charts to dice, so this is not for everybody.
I may even get a nice laser cut MDF "slider" contraption made. Call me crazy.
The odds are not the same as rolling dice. The Excel file used to calculate the odds "compresses" the results to the middle. So with 25 dice hitting on a 4+ you will score between 7 and 18 hits. While you can't get 25 hits, you also can't get 0 hits. (The 11-66 breaks the chances down in to 2.77% increments. The tail of the curve for dice rolls is often much, much smaller, so I round off). I think so long as both sides use the chart it will greatly speed up play and make the games better looking.
Here is a picture, along with a close up of the "slide" (sorry it's sideways):